Common UI Elements
Workspace List
The Workspace List manages which items are visible in each workflow/tab. Since not all items are relevant for all workflows, this supports the user to focus on a specific task. For example, spatial gene expression data of certain genes might be relevant as starting point for a Network Query but irrelevant for a Gene Expression Query. Items can be added either by browsing the database in the Browse Database workflow or as a result of a query (query item or query list item). Items can be filtered by their type with the tabs on the top of the list.
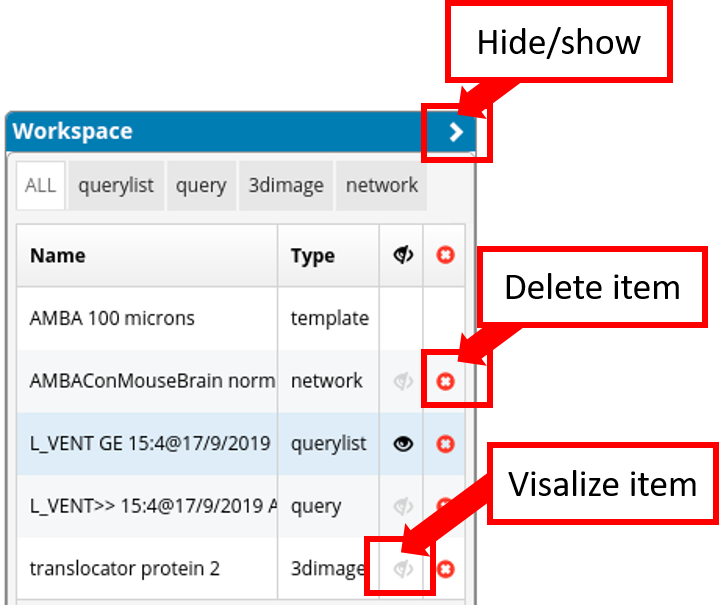
So we can either see all items or filtered by querylists, queries, 3dimage and network. One can perform two actions for each item:
Setting its visibility for the current selected workflow via the eye symbol next to its name. The visibility status of each item is independent for each workflow/tab; this allows to define the items that are relevant for each specific task. As a result, switching the workflows leads to different item visibility.
Removing an item from the Workspace List via the red x button.
It is also possible to select multiple items by holding the shift key. Actions for selected items can be performed via a click of the respective icon in the column header. Note that region items are not part of the Workspace List and can be controlled via the Parcellation Browser.
With a click on “>” on top of the Workspace list it can be retracted/hidden.
Parcellation Browser
The Parcellation Browser shows a hierarchically organized brain parcellation in a tree view, where every brain region has a name and a color code. This color-coding enables the user to relate to brain regions in the other UI elements. Its main purpose is to define the brain regions that are visualized in the (Expression and Connectivity) profiles as well as in the query item’s graph representation (node-link diagram of a target or a source connectivity query). The uppermost regions are the two hemispheres that can be expanded further down the hierarchy. Each major brain region has a color code from the Allen Brain Atlas that is varied in shade depending on its hierarchical level, providing an indirect reference to the larger anatomical context of a subregion and to the spatial position in the brain.

The “S” column shows the current region selection state (i.e. which brain regions are used in the other UI elements). Opening a region (+) automatically removes it from the region selection state and selects its subregions, while closing (-) deselects them. The second column with the magnifying glass adds a voxel-selection of the region to the Render View as a brush which can be further used for Visual Queries.
As for the workspace list, a click on “>” on can be used to hide this element.
Render View
We use classical volume rendering and multi-planar reformation to visualize volumetric data (3D image item, template item, query item) in its original spatial, anatomical environment. The data is rendered in 3D and in three planar slice views showing outlines of anatomical regions. Play around with the style, the layout and the tools to customize your visualization!
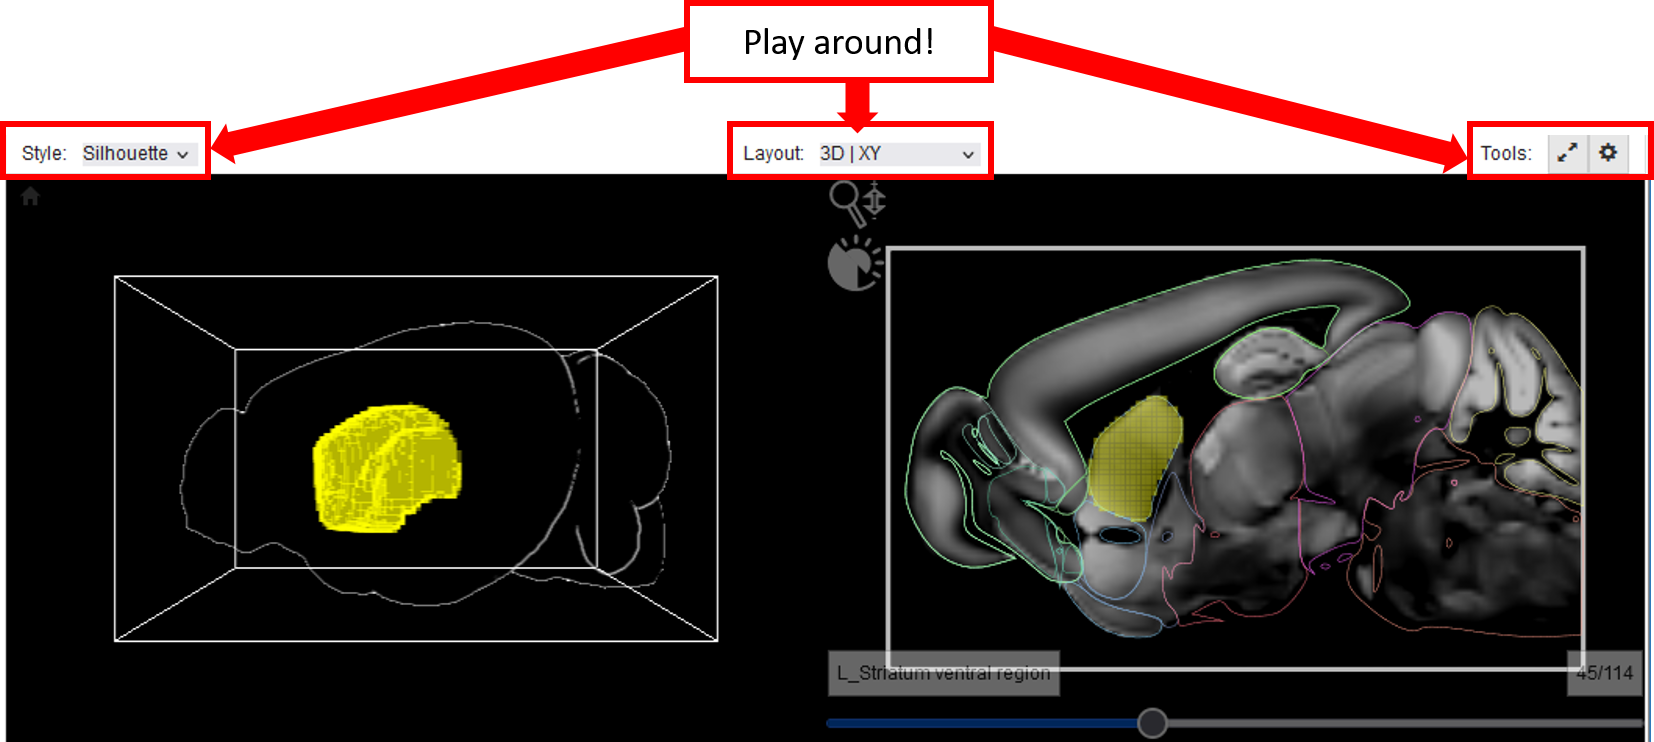
The layout of which views are shown (3D only, planar view only, all) can be set via the “Layout” button. The “All” button additionally enables a yellow cross hair to determine the position of a voxel in space. It can be control via the sliders of the individual planar views. The slider positions then indicate the exact coordinates of the cross hair in the voxel space. A maximum of four volumes can be blended simultaneously in 3D using single color-based transfer-functions (can be controlled in the Viewer Items List).
Several self-explanatory visualization options (e.g. text labels, visibility of the bounding box, background color) can be set in the “Display Options” via the “gearwheel” button.
Graphs (network item or graph representation of a query item) are rendered as ball-and-stick models.
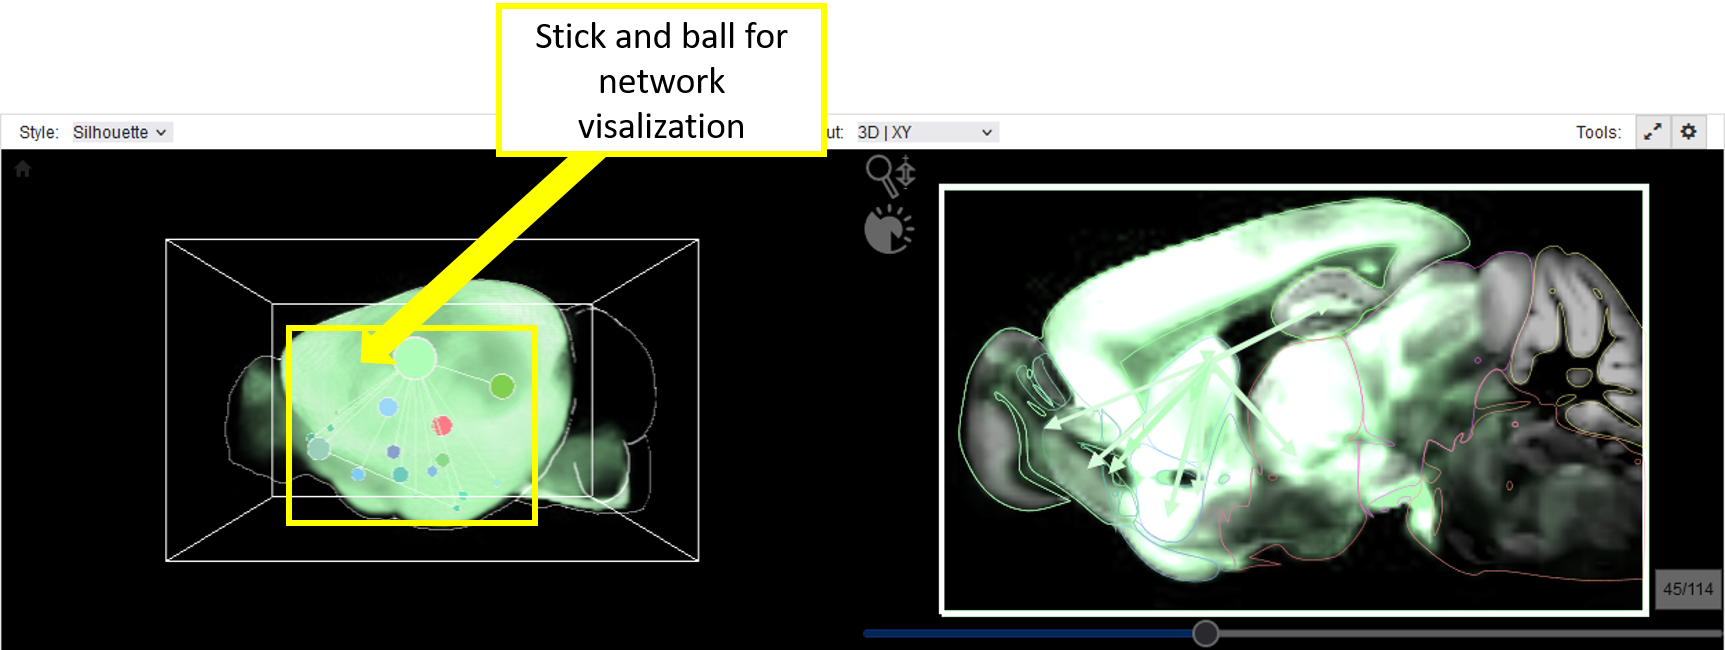
BrainTrawler further renders anatomical context in the planar view, visualized by region contours, and mesh geometry in 3D (if enabled via Viewer Items List) in order to provide anatomical context. 3D mesh rendering is turned off by default, since it would obstruct 3D volume rendering. For directed networks, edges are rendered as arrows, undirected network edges are represented by lines. For weighted networks, connectivity is color-coded, ranging from white to the color selected in the Viewer Item List so different networks can be visually distinguished. Edges and nodes are user-adjustable via color-transfer-functions. Moreover, thresholding edge weights (in the Network Analysis workflow) enables dynamical network refinement and an exploration of connections of interest. Node labels further support orientation (if switched on in the “Display Options” via the “gearwheel” button). In addition to the network model in the 3D view, network regions are shown as colored outlines of their anatomical equivalent in the corresponding 2D slice views; arrows (for directed) or lines (undirected networks) are rendered between the region centers in every slice. Although this shows only a part of the network (i.e. in the specific slice), it has the advantage that one can correctly render the regions by anatomy (instead of using a sphere), without facing the problem caused by possible occlusions in 3D.
Viewer Items List
The Viewer Items List on the very right side of BrainTrawler controls the visibility and appearance of the items rendered in the UI elements.
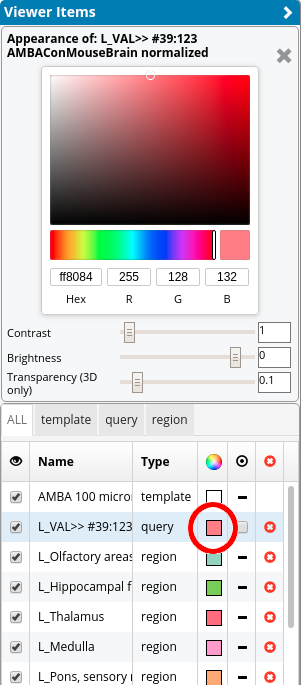
It contains all elements that are visible for the current workflow (set in the Workspace List) and all entries for all regions in the region selection state (see Section Render view). Therefore, the items in the Viewer Items List can be different for each workflow. The appearance (the color, brightness, contrast, and transparency) of 3D images, template, regions, and query items can be controlled in the Appearance Widget. This widget can be opened by clicking on the colored box in the row of each individual item. For query items (i.e. connectivity), the visibility of the graph representation can be set in the column that looks like a “target circle”. Items can be removed from the list Viewer Items List via the red x button (note that they still remain in the Workspace List!).
Profiles
Connectivity Profiles (the profile of a query item) as well as Expression Profiles (the profile of a 3D image of a gene) summarize volumetric voxel-level data in order to make them quantitatively comprehensible. They visualize the mean target/source connectivity or gene expression for brain-regions in bar graphs. These brain regions are defined by the region selection state, the selection that has been made in the Parcellation Browser .
The mean connectivity/expression of all subregions are rendered as dots. This allows both to identify regions that have highly connected/expressed subregions, and to further refine the anatomical hierarchy to focus on relevant subregions. For anatomical context, the colors of the bars and dots are corresponding to the Parcellation Browser. Names are made visible via a tooltip on demand, since a direct rendering with the bars would cause clutter.

As described in Network Query and Gene Expression Query one or multiple regions can be picked for a high-intensity VOI selection, which enables the user to threshold for high expression/connectivity voxels in a separate dialog. This allows higher order target/source connectivity queries in an iterative workflow. This threshold querying can be started by selecting regions by clicking on the respective bars. A click on “add high-intensity VOI” will open a dialog. A histogram of voxel-level intensities (i.e. connectivity or gene expression) within the selected regions can be used to decide which intensity, and therefore which voxels, will be selected. The selection will be shown in the Render View, which can then be used as a starting point for other queries.
For Connectivity Profiles, the percentual composition of the query region is shown in a bar above the profile to indicate the queries anatomical context. It uses the same parcellation/color code as the profile, and reveals its region names via mouse-over. Furthermore the query region can be added again to the Render View, so that one can reproduce the query with the same or other connectivity matrices.
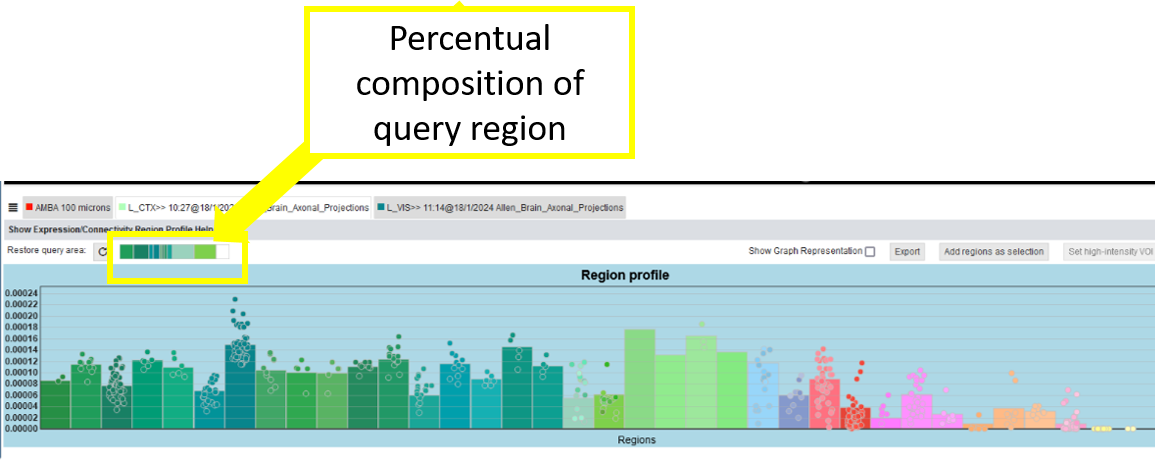
Profiles can be visualized in an overview next to the Render View to show multiple profiles below each other (“bars” - icon next to the tabs of visible profiles). Therefore, regions are aligned vertically which enables comparability between multiple profiles.
Gene lists
Gene lists show tabular information about spatial gene expression data by their name, fullname, entrez ID, ensemble ID, species, probability of being expressed, expression and rank. The list can be filtered for genes that have specific functional associations textually.
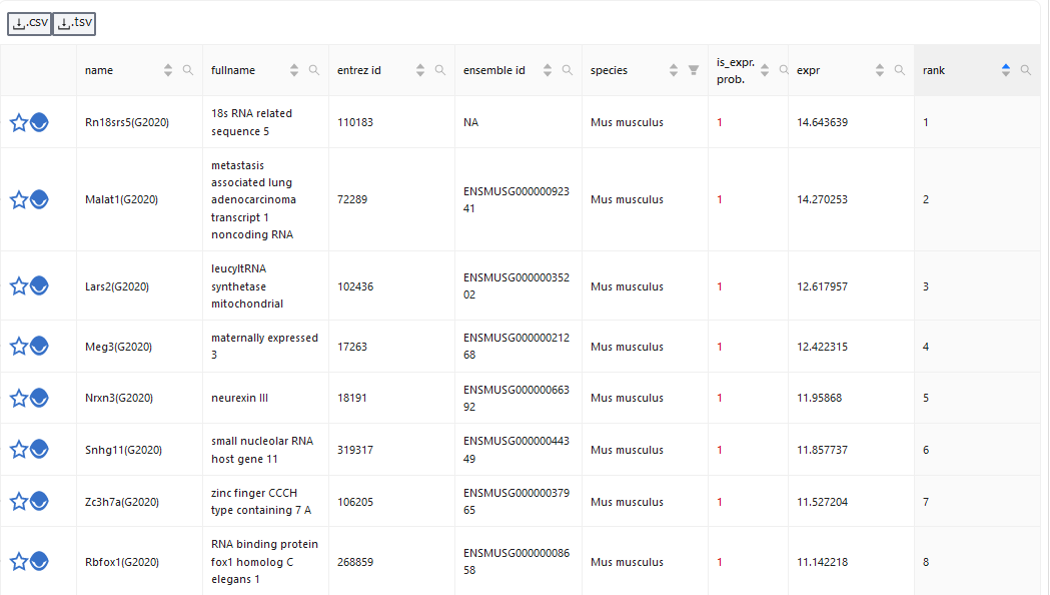
The lists can also be downloaded as csv or tsv.
Parallel Coordinates System
A parallel coordinates system allows the filtering of multiple gene lists from different brain regions by their gene expression. With the parallel coordinates system, one can interactively select genes that have a different specificity for different regions (for example to find ligand-receptor systems). Each axis represents a gene expression query, and as a consequence the gene expression specificity for the query regions (the color of a label indicates the color of largest region in the query’s VOI ). Each line represents a gene. The selection can be made drawing brushes (the grey boxes) on the axis to select for genes with specific gene expression patterns. You can remove the filters with the “Clear Brushes” button (currently the brushes are also discarded when tabs are switched).


