Getting started
Currently, there are two versions: BrainTrawler Mouse and BrainTrawler Human .
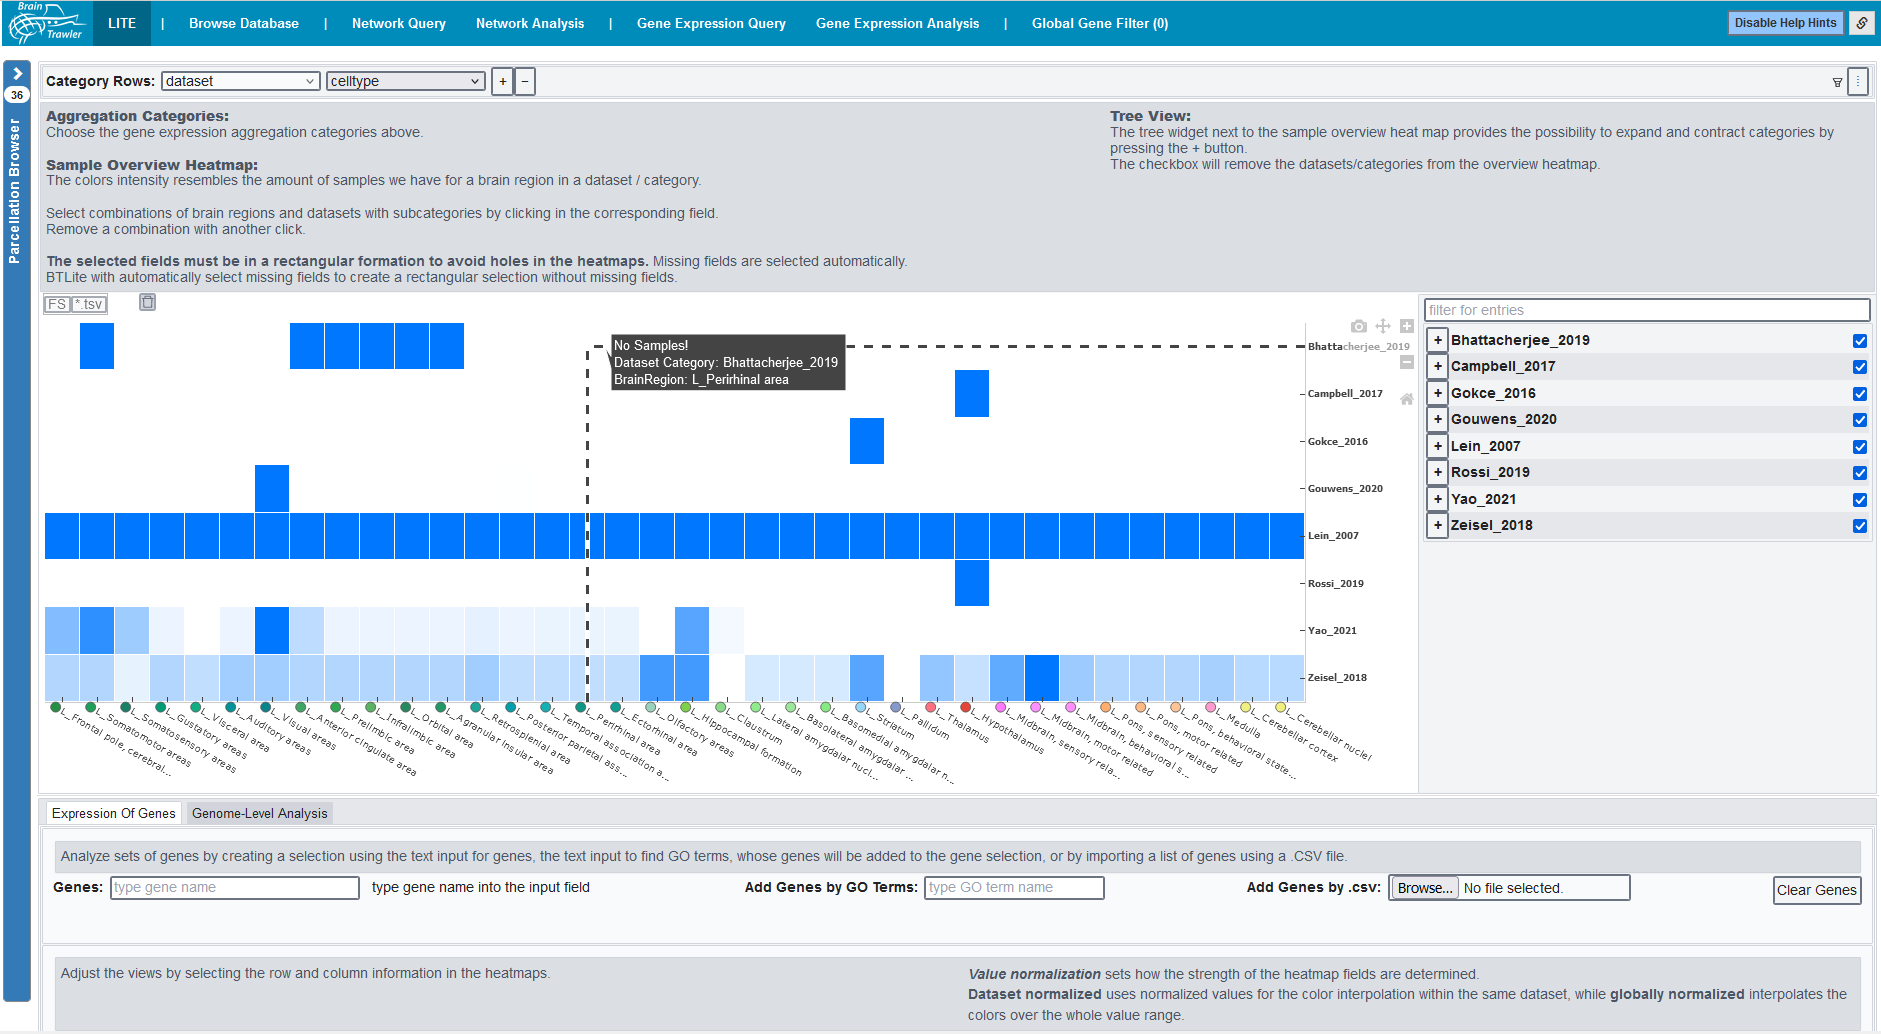
When starting BrainTrawler, the first page will look like this:

On top, you see several tabs. Each tab represents a workflow, see Workflows for a description of the individual tabs.

The workflows you can do with BrainTrawler are:
BT LITE : This workflow serves as a starting point for dataset exploration: Here, dataset coverage per dataset (e.g. brain region, celltype, phenotype,…) is visualized as a heatmap.
Browse Database: This workflow represents the starting point for all other workflows. The user can browse the data collections and add it to the workspace list.
Explore regions: Here several queries and analyses to explore brain regions are summarized:
Network Query: Here, the user can execute target/source queries to explore local brain network connectivity visualized in an anatomical context (2D/3D rendering, bar charts).
Network Analysis: Connectivity can be analyzed and compared as region-level networks on different anatomical scales.
Gene Expression Query: In this workflow, gene expression queries can be performed to see which genes are specific for certain brain regions. Also a Differential Gene Expression Analysis (DGEA) can be performed.
Gene Expression Analysis: Here, one can compare the gene expression for different brain regions or parts of a network.
Brain Activity Query: With this you can perform queries based on brain acitivty data.
Explore Circuits: Here you find the functionality to create and explore brain circuits, which consist of several nodes:
Create and edit circuits: Here, you can create, edit and visualize brain circuits.
Circuit query: Here, you can perform queries on your whole circuit of individual nodes.
The list of the public Brain Transcriptomic And Connectivity Data (BrainTACO), you can investigate with BrainTrawler, can be found at Data in BrainTrawler .
Some more detailed description of principles and single elements of BrainTrawler are described in Basic Principles and Common UI Elements.
Of interest could also be our video about The Exploration of Heterogeneous Spatial Big Brain Data . The tool looks a bit different in the video, because it is an older version of BrainTrawler. However, the basic functionality remains.
