Basic Principles
Workflow Centric UI design
BrainTrawler uses a workflow-centric user-interface (UI) design, which divides the web application into several tabs. Each tab represents a workflow, a specific task that can be performed to explore the data. These workflows are indicated on top of the site. Their order reflects the principle experimental procedure for genetic dissection of networks.

Each workflow has its own set of items, for example spatial neurobiological data (e.g. 3D images), a network etc. These can be analysed with workflow dependent UI elements. So each workflow/tab uses a different set of UI elements to interact with the data items relevant for this task. A detailed description of the workflows can be found in Workflows.
Item Types
The data that BrainTrawler uses is structured in so called items. Each item represents spatial neurobiological data, i.e. data that is somehow related to spatial positions in the brain. All items in BrainTrawler’s database can be browsed in the Browse Database workflow.
An item can be from the BrainTrawler database or from an user interaction.
Items in BrainTrawler’s database
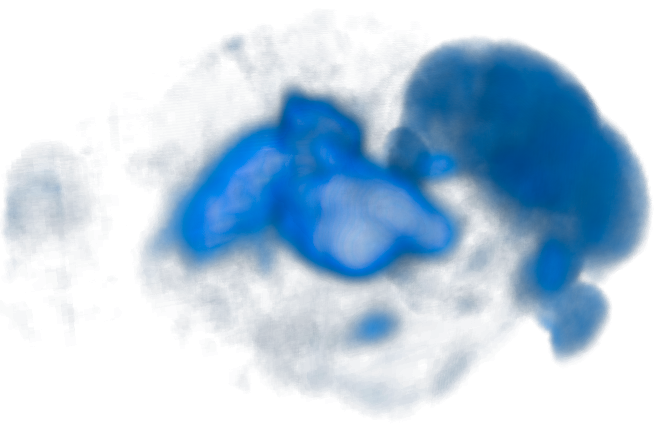
3D image item: Volumetric data. For example the gene expression of a gene or functional activity from fMRI.
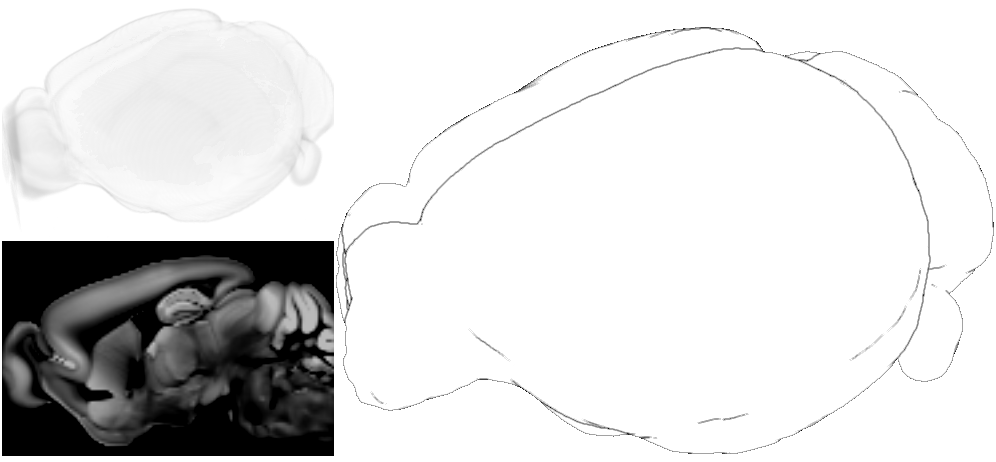
Template item: The anatomical reference of the brain. Represented by a template image (also a 3D image) or it’s silhouette.
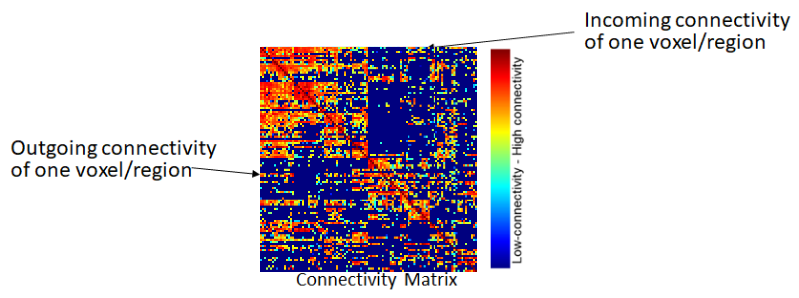
Network/Connectivity Matrix item: Represents the connectivity between voxels or regions in the brain. Consists of nodes (voxels or regions) and edges (connections). On a region level, they can be rather small (up to ~500 nodes), but on a voxel level they can have ten thousands of nodes with billions of connections.
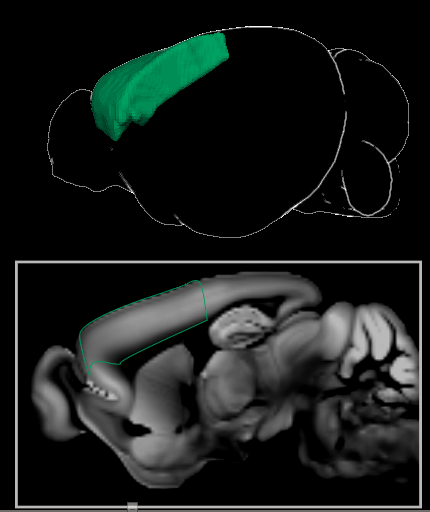
Region item: Represents a brain region from the Allen Brain Atlas http://atlas.brain-map.org . It defines an 3D area (volume) in the brain (=a set of adjacent voxels). Furthermore, each region has a name, a short name and an unique color coding, all defined by the Allen Brain Atlas. These items can be found in the Parcellation Browser.
Items that are results of an user interaction (when a user performs a query)
Query item: Represents the result of a visual query that has been executed on a connectivity matrix (a network query). Visual queries are requests to BrainTrawler’s database that are based on selections of a volume of interest (VOI - a set of voxels, defining an arbitrary region in the brain). For example, a target or a source connectivity query retrieves the aggregated outgoing/incoming connectivity of all voxels of a VOI.
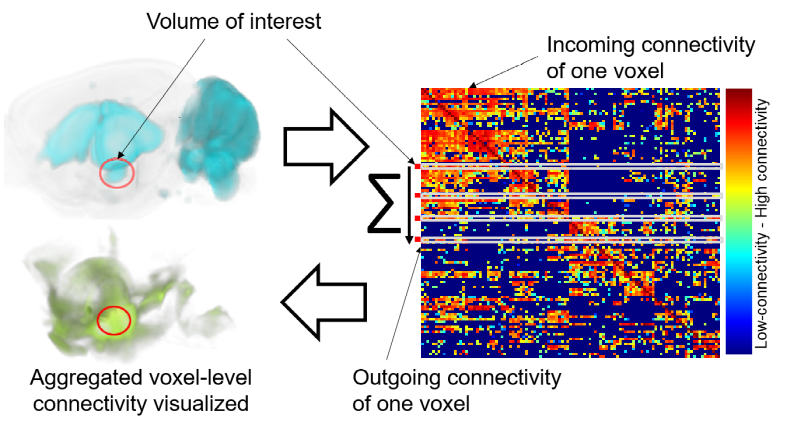
The name of a query consists of the short name of the brain region that covers the largest part of the VOI (this region also defines the color of the visualization), if it’s either outgoing or incoming, it’s execution time, and on which network/connectivity matrix it has been executed. e.g. L_VENT>> 15:04@17/9/2019 AMBAConMouseBrain. The following image shows the outgoing connectivity of a VOI (yellow circle) on a voxel level (in green, left), and on a region level graph representation(regions indicated by spheres, right).

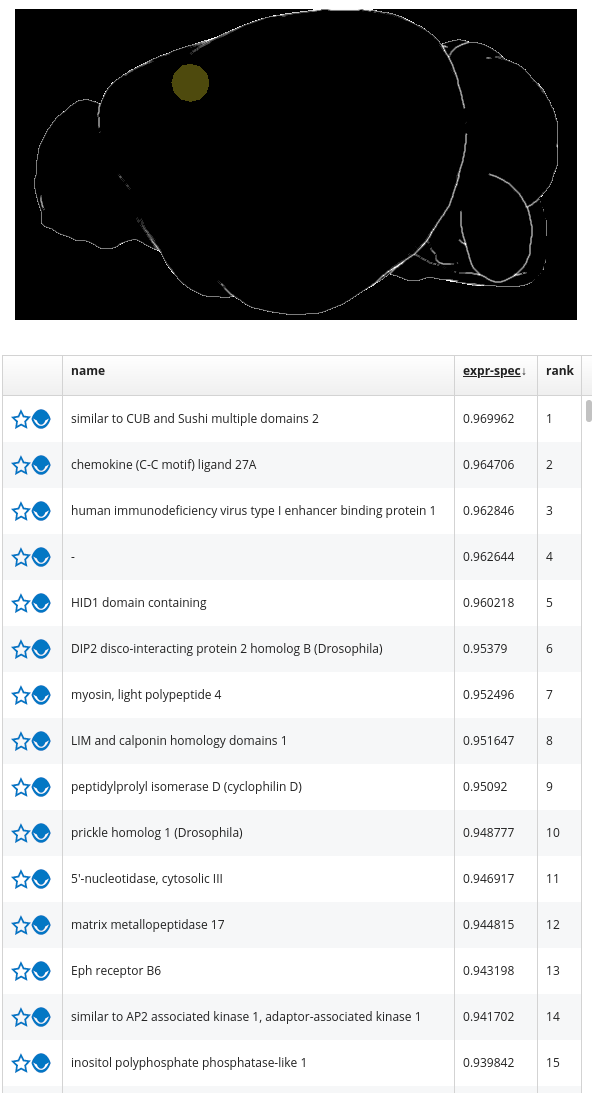
Query List Item: Represents the result of a visual query that has been executed on a set of 3D images (e.g. the 3D images indicating the gene expression of 19.000 genes). For example, a gene expression query returns a list of genes ordered by their specificity for a VOI. Therefore, BrainTrawler accesses the 3D images of 19.000 genes and computes their mean gene expression within the VOI. The resulting list is shown below the render view.
Visual Queries
We use a visual query paradigm to realize connectivity and gene expression queries. A visual query allows requests to BrainTrawler’s database that are based on selections of a volume of interest (VOI) directly in the planar slices of the Render View. The response can then be shown in the 2D/3D visualization and connectivity profile (for a network query) or as query list (for Gene Expression Queries).
In the Render View the selection of a VOI can be performed in four different ways: Brush-selection, region-selection, network-nodes-selection or high-intensity- selection.

Brush-selection is performed from the Query Toolbar in the Network Query or Gene Expression Query workflow. Here, one can draw spherical areas encoded in transparent yellow in the 2D slice views, which are also directly rendered in 3D.
You can also select a region by name, this selects all voxels within this region rendered as transparent yellow cubes.
It is also possible to select the nodes of networks (i.e. the regions that represent the nodes of a network). This is similar to selecting the individual regions of a network manually, but it can be done in a single step in the Network Analysis workflow.
High-intensity queries are started from the Expression or Connectivity Profiles. This allows the selection of voxels with high intensity within user-selected brain regions. Here, one selects brain regions of interest in a Profile. By clicking the ”add high-intensity VOI” button, a dialog appears which shows a voxel-level histogram of the intensity values within this region. High-intensity voxels can be defined by setting a threshold. In the Render View, the voxels are instantly selected and visualized, similarly to the region-selection.
The resulting VOI can then be used as an input for Network Queries Network Query and Gene Expression Queries Gene Expression Query.
